Like any average guy in his late 40s, anticipating the upcomming spring, I get an urge to write another random walk algorithm. No fooling Mother Nature, folks, let's face it!
This time I tried the following approach:
- Start at the origin, with an azimuth of 2°.
- Take a step.
- Find the next prime number following 2 (that is, 3)
- Turn 3° - now the azimuth is 5°
- Take another step.
- Following 3, the next prime number is 5
- Turn 5° - now our azimuth is 10°
- Take a step.
And so on, and so forth, for, say, 100 or 1,000 or 100,000 steps. What will our path look like?
As it turns out, quite different from all the random paths I've managed to sweat out so far!
If we limit things to the first 50 steps, the result is less than impressive:
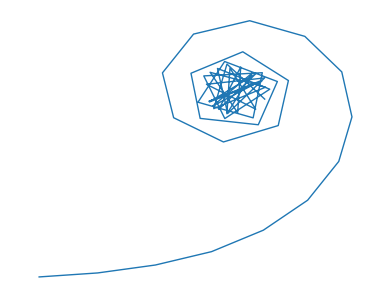
But increasing the step counter to a hundred has an intriguing effect:
What has just happened here?
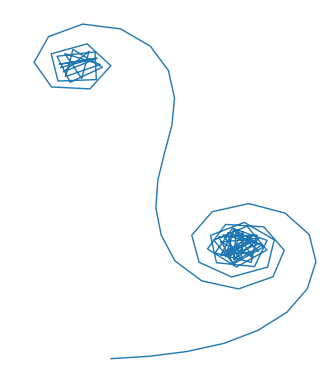
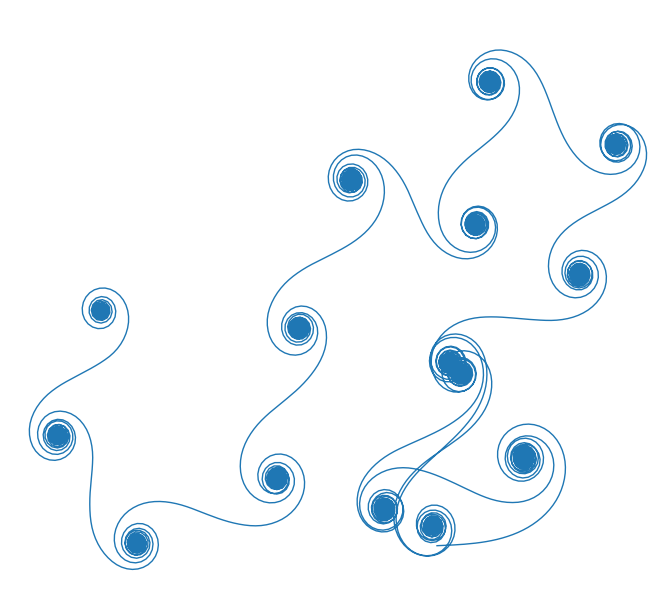
In the middle of the spiral there is a tangle, because our turns get sharper (by more than a right angle) so we are basically trotting in place (technically not "in place" but "within a small area"). But since a circle is a circle and the turn angle at one point exceeds 270 degrees - that is, a right angle "inside-out" - having scribbled a centre of a spiral, we "run away" from it with a straightening piece of the curve. When we reach 360 degrees (that's the piece of reasonably straight path between the two spirals), the situation repeats and we produce another spiral. What if we now increase the number of steps to, say, 1000?
This is starting to look quite interesting. Fairly random and at the same time kind of repetitive. It is not a fractal, but I still like it.
Further increasing the number of steps doesn't yield anything stunning really. For example, for 100,000 steps we get something like this:
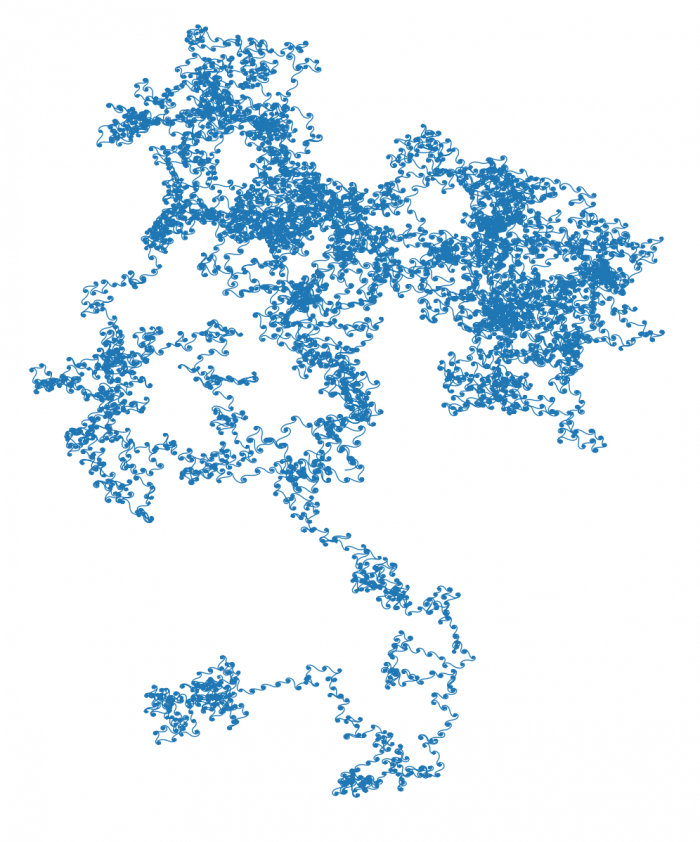
Yes, it's cool, but it could be upgraded in some way.
(...thinking in progress...)
Let's first start with the fact that it would be helpful to soften those sharp corners a bit.
The original code:
import matplotlib.pyplot as plt
from math import radians, sin, cos
from sympy import nextprime

xlist, ylist = [0.0], [0.0]
x, y = 0.0, 0.0
angle_degrees = 2
angle_radians = radians(angle_degrees)
lw = '0.5'  # line width
for n in range(500):
    angle_degrees = nextprime(angle_degrees)
    angle_radians += radians(angle_degrees)
    x += cos(angle_radians)
    y += sin(angle_radians)
    xlist.append(x)
    ylist.append(y)

plt.xticks([])
plt.yticks([])
plt.box(False)
plt.plot(xlist, ylist, linewidth=lw)
plt.show()
… and a minor adjustment making the turns smoother (at the cost of increasing the number of steps though):
import matplotlib.pyplot as plt
from math import radians, sin, cos
from sympy import nextprime

xlist, ylist = [0.0], [0.0]
x, y = 0.0, 0.0
angle_degrees = 2
angle_radians = radians(angle_degrees)
lw = '0.5'  # line width
for n in range(10000):
    angle_degrees = nextprime(angle_degrees)
    angle_radians += radians(angle_degrees/20)
    x += cos(angle_radians)
    y += sin(angle_radians)
    xlist.append(x)
    ylist.append(y)

plt.xticks([])
plt.yticks([])
plt.box(False)
plt.plot(xlist, ylist, linewidth=lw)
plt.show()
Result:
Okay. What else could we possibly do here…
It's kind of monochromatic, isn't it? Let's try to add some colour. But how?
We'll modify our code so that the walk line changes colour every time we encounter a prime twin number:
import matplotlib.pyplot as plt
from math import radians, sin, cos
from sympy import nextprime
from itertools import cycle

xlist, ylist = [0.0], [0.0]
x, y = 0.0, 0.0
angle_degrees = 2
angle_radians = radians(angle_degrees)
lw = '0.5'  # line width
colors = cycle('bgrcmk')
for n in range(10000):
    previous_angle = angle_degrees
    angle_degrees = nextprime(angle_degrees)
    if (angle_degrees-previous_angle == 2):
        plt.plot(xlist, ylist, linewidth=lw, c = next(colors))
        xlist, ylist=[x],[y]
    angle_radians += radians(angle_degrees/20)
    x += cos(angle_radians)
    y += sin(angle_radians)
    xlist.append(x)
    ylist.append(y)

plt.xticks([])
plt.yticks([])
plt.box(False)
plt.show()
Result?
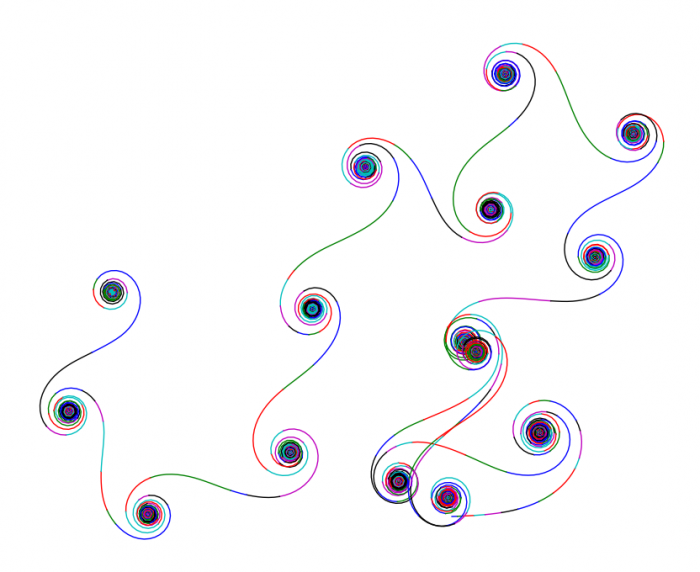
Meh. I don't like it. The colours in the middle of the spirals overlap, and it's still boring. Let's put on our creative hat…
How about flipping the turn direction every time we hit a twin prime instead?
import matplotlib.pyplot as plt
from math import radians, sin, cos
from sympy import nextprime

xlist, ylist = [0.0], [0.0]
x, y = 0.0, 0.0
angle_degrees = 2
angle_radians = radians(angle_degrees)
lw = '0.5'  # line width
flip = 1
for n in range(10000):
    previous_angle = angle_degrees
    angle_degrees = nextprime(angle_degrees)
    if (angle_degrees-previous_angle == 2):
        flip *= -1
    angle_radians += flip * radians(angle_degrees/20)
    x += cos(angle_radians)
    y += sin(angle_radians)
    xlist.append(x)
    ylist.append(y)

plt.xticks([])
plt.yticks([])
plt.box(False)
plt.plot(xlist, ylist, linewidth=lw)
plt.show()
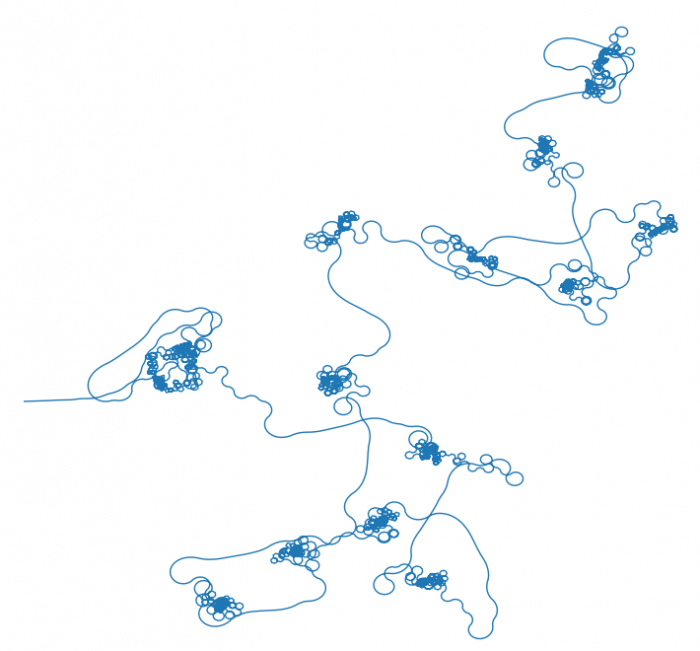
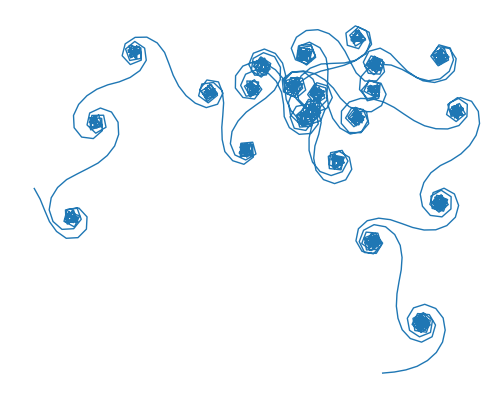
Now we're talking! A qualitative change, finally. You can clearly see the places where the turn direction flips rather than sinking into the "gravity well" of another spiral.
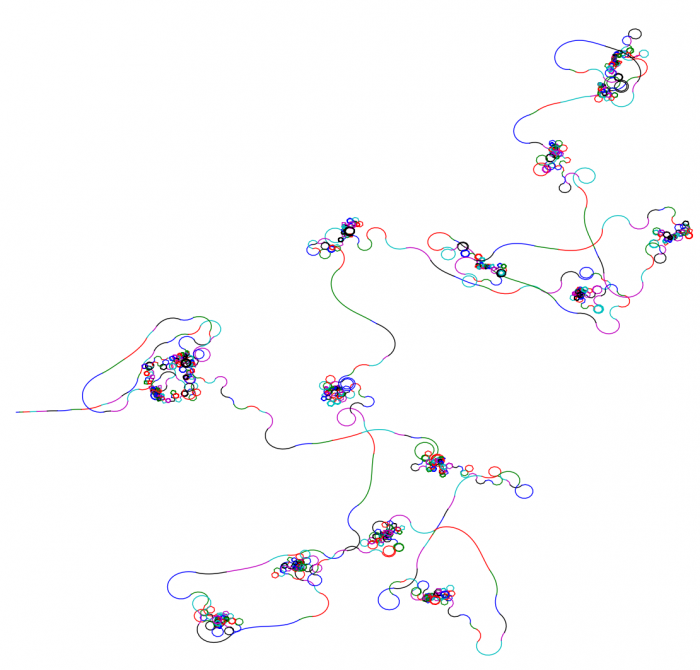
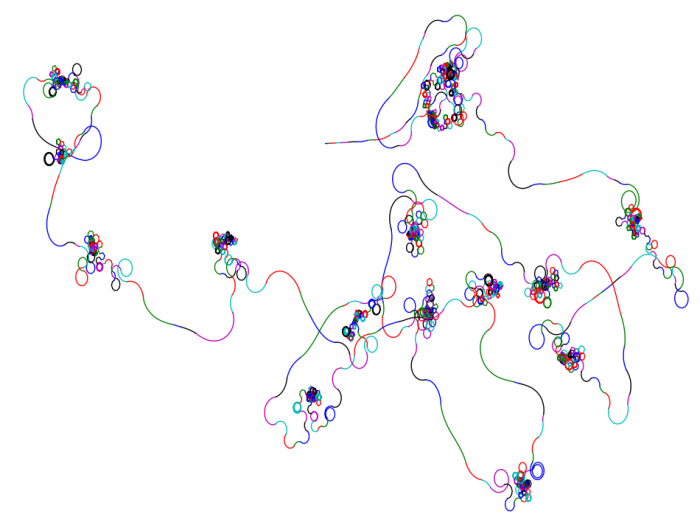
How about bringing back the idea of colouring (from the previous version of the script) while keeping the idea of flipping turns?
import matplotlib.pyplot as plt
from math import radians, sin, cos
from sympy import nextprime
from itertools import cycle

xlist, ylist = [0.0], [0.0]
x, y = 0.0, 0.0
angle_degrees = 2
angle_radians = radians(angle_degrees)
lw = '0.5'  # line width
flip = 1
colors = cycle('bgrcmk')
for n in range(10000):
    previous_angle = angle_degrees
    angle_degrees = nextprime(angle_degrees)
    if (angle_degrees-previous_angle == 2):
        flip *= -1
        plt.plot(xlist, ylist, linewidth=lw, c = next(colors))
        xlist, ylist=[x],[y]
    angle_radians += flip * radians(angle_degrees/20)
    x += cos(angle_radians)
    y += sin(angle_radians)
    xlist.append(x)
    ylist.append(y)

plt.xticks([])
plt.yticks([])
plt.box(False)
plt.show()
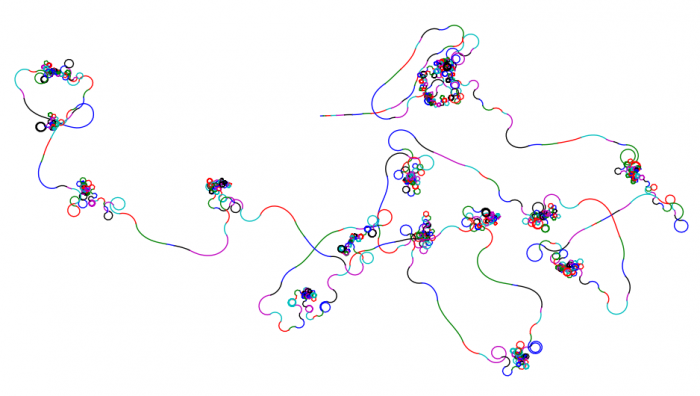
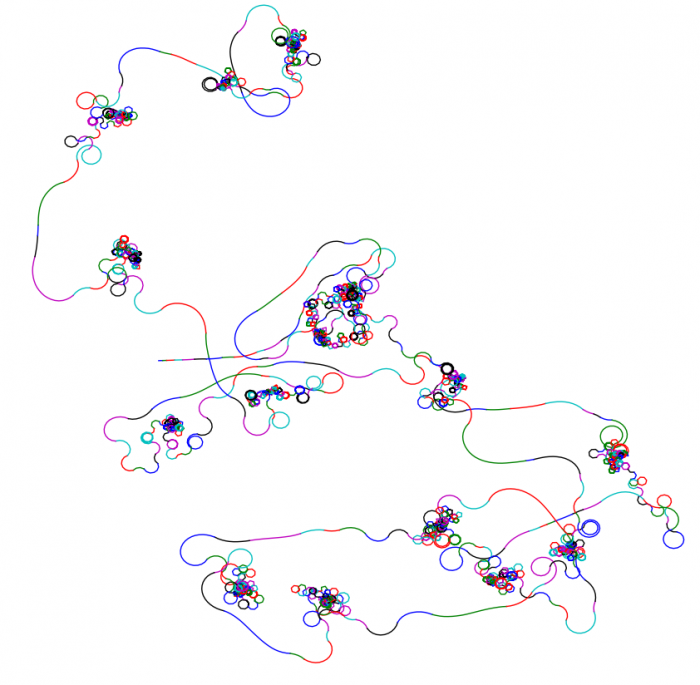
import matplotlib.pyplot as plt
from math import radians, sin, cos
from sympy import nextprime
from itertools import cycle
from random import random

xlist, ylist = [0.0], [0.0]
x, y = 0.0, 0.0
angle_degrees = 2
angle_radians = radians(angle_degrees)
lw = '0.5'  # line width
flip = 1
colors = cycle('bgrcmk')
for n in range(10000):
    previous_angle = angle_degrees
    angle_degrees = nextprime(angle_degrees)
    if (angle_degrees-previous_angle == 2):
        flip *= -1
        plt.plot(xlist, ylist, linewidth=lw, c = next(colors))
        xlist, ylist=[x],[y]
    angle_radians += flip * radians(angle_degrees/20) * (1 + random()/1000.0)
    x += cos(angle_radians)
    y += sin(angle_radians)
    xlist.append(x)
    ylist.append(y)

plt.xticks([])
plt.yticks([])
plt.box(False)
plt.show()
The topic can be dragged on basically indefinitely, but for the moment I have had enough. However, I am sure that random walks will still make an appearance here more than once.
Jeżeli chcesz do komentarza wstawić kod, użyj składni:
[code]
tutaj wstaw swój kod
[/code]
Jeżeli zrobisz literówkę lub zmienisz zdanie, możesz edytować komentarz po jego zatwierdzeniu.